Published November 9, 2023
What's up with Real Estate? Weekly Round Up 11.10.2023


Real Estate News in Brief
I’ll be honest, it’s been a real bummer sharing mostly discouraging news about the housing market over the past few weeks. While this week is not quite rainbows and cupcakes, there is good news to share for buyers (a big move down in mortgage rates) and sellers (home prices continue to rise). It’s Thanksgiving month, so let’s be grateful for small things too.
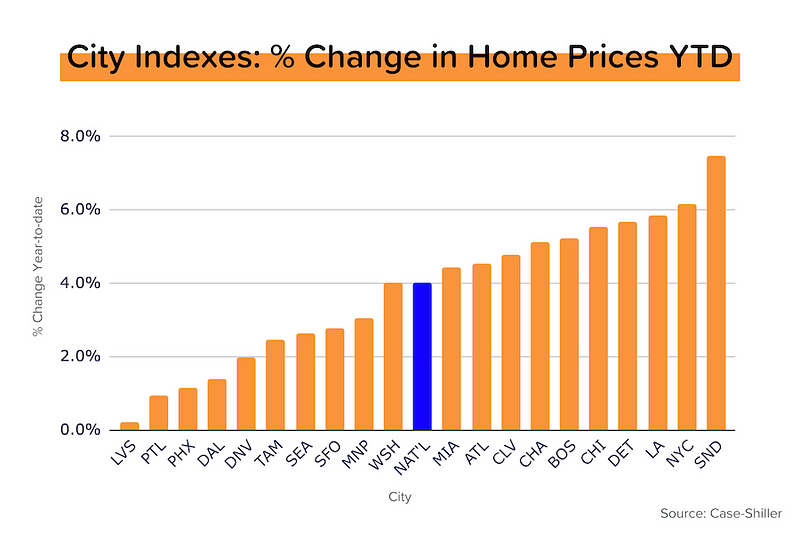
Case-Shiller Index makes it 7 in a row. The national home price index rose 0.9% MoM in August 2023, an acceleration from +0.7% in July 2023. Prices have already risen 4% year-to-date, and are 1.5% above their previous peak in mid-2022. More details on the individual city indices below. [S&P Global]
FHFA Index makes it 12 in a row. Home prices rose 0.6% MoM in August 2023, a deceleration from +0.8% in July 2023. Prices have risen 6% year-to-date, and are 4.7% above their previous peak in mid-2022.
Wondering why these two are always a bit different? Like Case-Shiller, the FHFA index tracks transaction pairs, the most accurate way to measure home price appreciation. But the FHFA index only looks at transactions financed with a conforming mortgage. So no all-cash transactions, and no jumbo loans.
That sinking feeling in Europe. Eurozone GDP contracted 0.1% in the 3rd quarter. The German, Irish and Austrian economies all went backwards, while France barely grew. “Headline” Eurozone inflation, meanwhile, fell more than expected to +2.9% YoY, and “core” inflation dropped from 4.5% to 4.2% YoY.
Still adding jobs, just slower. ADP’s monthly employment report showed that private employers added 113,000 jobs in September. For most of 2023, the 3-month average was >200,000. Wage growth slowed further, but remained elevated at +5.7% YoY for job stayers and 8.4% for job leavers. A year ago, those figures were +7.7% & +15.4%, respectively. [ADP]
What the Fed said. The Federal Reserve kept its policy rate steady at 525–550 basis points (5.25–5.50%) for the second-straight meeting. This, in and of itself, is ‘dovish,’ notwithstanding Chairman Powell’s usual rhetoric.
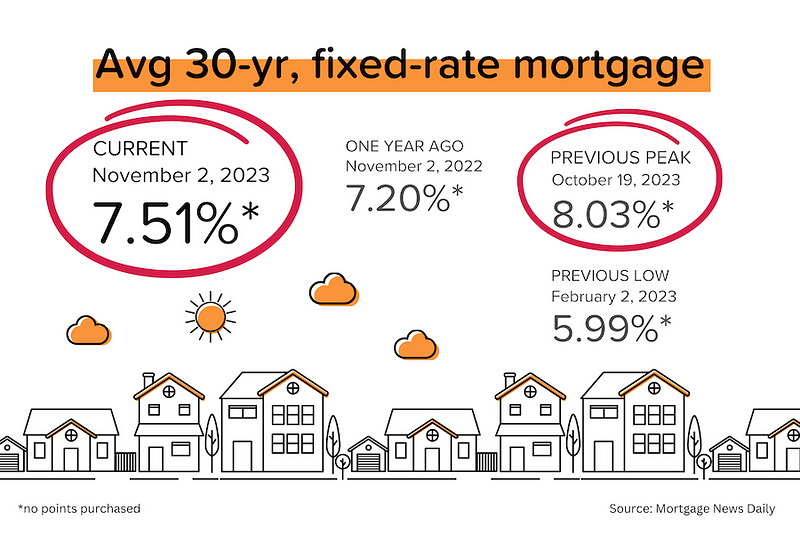
The bond market liked it. Even though pretty much everyone expected the Fed to do nothing, bond prices still rallied aggressively (pushing yields lower). How much of that was the weaker-than-expected ADP and ISM data versus Powell’s press conference we’ll never know, but average 30-year mortgage rates dove to 7.51%.
On the Case (Shiller)
The mass media tends to focus on Case-Shiller’s national price index. That’s understandable, but real estate is a local game, so let’s dive into the big city indexes:
- 10 of the 20 individual big city indices set new all-time highs. Chicago and New York are already 5% above their mid-2022 peaks. Cleveland is 4% above.
- San Diego prices are up 7.5% ytd! New York City is +6.1% ytd. None of the 20 big city indices are down ytd.
- Los Angeles, San Diego, and Tampa Bay are VERY CLOSE to setting new highs. It is highly likely that all three will hit new highs next month.
- San Francisco (-9.4%), Seattle (-7.3%), Las Vegas (-6.5%), and Phoenix (-6.1%) are still well below their mid-2022 peaks, but Seattle and Las Vegas are rebounding quickly.
Reminder: We pay extra attention to the Case-Shiller index because it provides the most accurate measure of home price appreciation. By tracking large numbers of transaction pairs (e.g. House A sold in October 2017 at $300,000 and again in January 2024 at $550,000), the Case-Shiller index comes closest to measuring ‘true’ appreciation. Many of the other home price measures are skewed by the mix (high-end vs. low-end) of properties being sold during the period.
Biggest Builders Getting Bigger and Public-er (Sorry)
In 1989, the Top 10 builders represented just 9% of new home sales nationwide. In 2000, this had doubled to 19%. And by 2022, it had doubled again to an incredible 43% of unit sales! And the Top 20 represented 53% of all sales. The homebuilding industry is becoming increasingly concentrated.
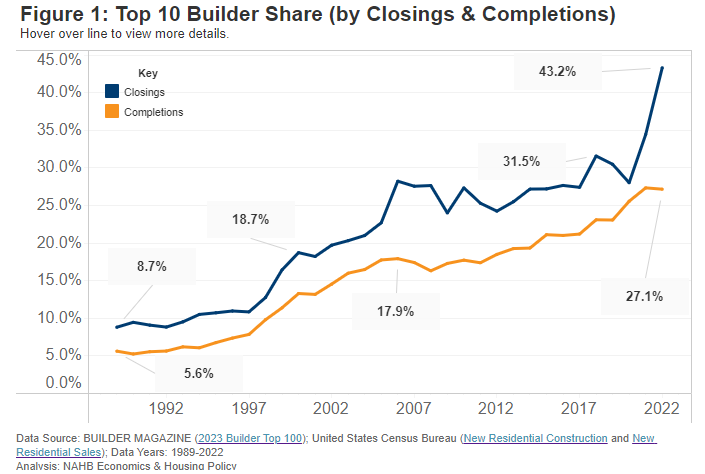
In 2022, nine of the Top 10 builders were publicly-listed. And 17 of the Top 20 builders were publicly-listed. In other words, most of these Top 20 builders have a share price that changes daily. They have to think about increasing shareholder value (getting the stock price up, paying dividends, or buying back shares.) And executive compensation is often tied to the share price in one of various ways. The homebuilding industry is increasingly public (listed.)
I’m not saying that going public is bad. But I’ve spent 20 years analyzing public companies and I know for sure that public companies behave differently than private companies. Public companies don’t build homes out of the goodness of their hearts. They build homes because they believe they’ll generate a solid margin and a strong return on invested capital.
In a way, we’re increasingly reliant on public companies (listed builders) to provide a public good (new homes to address the housing shortage.) Hmmmm.
When the Fed stops
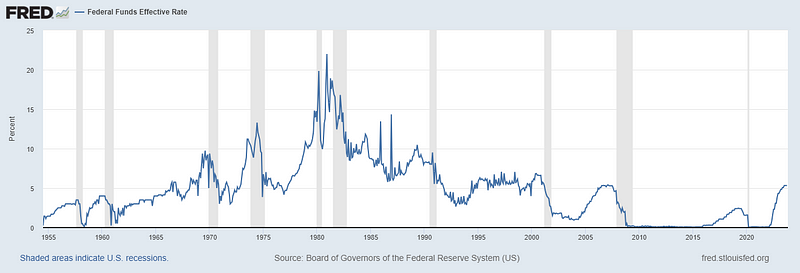
It’s possible that this time is different. But it usually isn’t. After an aggressive Fed tightening cycle, rates rarely stay ‘higher for longer,’ and the landings are scarcely ‘soft.’ And as a reminder, this has been a very aggressive Fed tightening cycle by historical standards.
The blue line in the graph below is the effective federal funds rate. The light gray bars indicate recessions. Do you see what I see?
- A sharp price in the fed funds rate almost always precedes (precipitates?) a recession.
- ‘Higher for longer’ is standard verbiage from the Fed, but just try to find it on the graph. (The closest is the plateau between 2007–2008.) ‘Overdid it and now regret it’ seems more common.
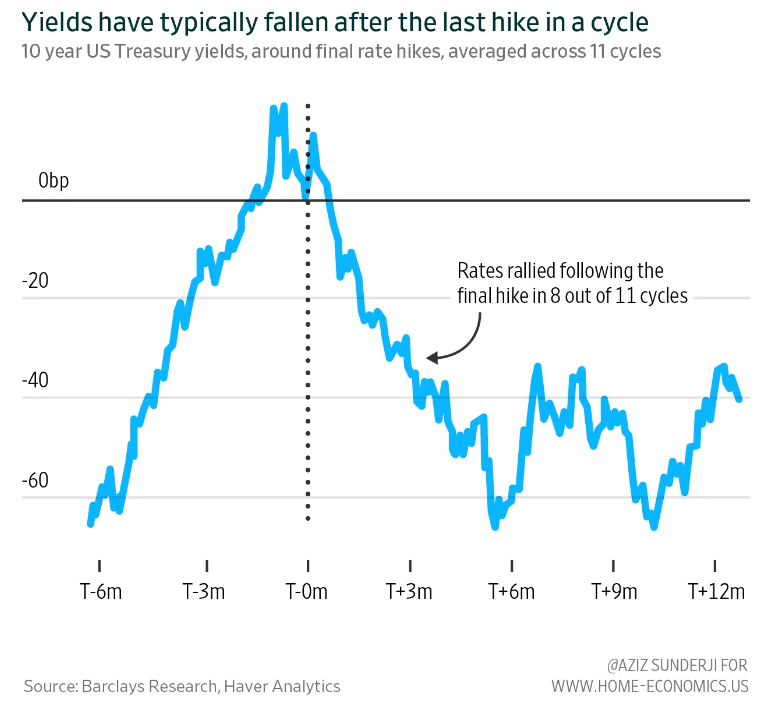
No matter what Federal Reserve Chairman Jerome Powell says, we’re nearing the end of this rate tightening cycle. And when the Fed stops, US treasury bond yields (and mortgage rates) usually have a big move lower. What we’ve seen over the past few days might well be part of that, as the market interprets the Fed’s double ‘skip’ as an unspoken ‘stop.’ [Thanks to my friend Aziz from Home Economics for the chart below.]
Mortgage Market
Bond movements have shaved more than half a percent off average mortgage rates in the past few days. Look, 7.5% is still a big number, but let’s just be happy that it’s lower than 8%.
The next FOMC (Federal Open Market Committee) meeting is on December 13. At the moment, the market is only putting a 15% probability on another +25 bps rate hike. In other words, the market is putting an 85% probability on a third-straight pause.
They Said It
“No single industry dominated hiring this month, and big post-pandemic pay increases seem to be behind us. In all, October’s numbers paint a well-rounded jobs picture. And while the labor market has slowed, it’s still enough to support strong consumer spending.” —Nela Richardson, ADP Chief Economist
“On a year-to-date basis, the National Composite has risen 5.8%, which is well above the median full calendar year increase in more than 35 years of data. The year’s increase in mortgage rates has surely suppressed housing demand, but after years of very low rates, it seems to have suppressed supply even more. Unless higher rates or other events lead to general economic weakness, the breadth and strength of this month’s report are consistent with an optimistic view of future results.” —Craig Lazzara, S&P Global Managing Director
|


or another way